Tuesday 30 December 2008

Vincent De Roeck & the climate change hoax

While the leading politicians grow older and older, it's time for a younger generation to stand up and take over from the present generation. One of the young people walking the trail towards national politics is 23-year old Vincent De Roeck, A Belgian liberal with libertarian influences who is involved in several political groups around the liberal party VLD.

De Roeck is president of the think thank Nova Libertas; vice-president of the LVSV (a student organisation of Flemish liberals, where several liberal ministers started their career). For at the moment he's still unknown to the general public, it might be a good idea to have a look at who is. On his personal website he introduces himself as follows:
I'm a student (law & political sciences) and for years have been publishing and been engaged in politics in Flanders and abroad. As a young dynamic force I’ve put my shoulders below many successful projects. Above that, i’m definitely not an intellectual nobody. Not without a reason in 2007 the well respected American magazine National Review called me a ‘prominent intellectual’ for my razorsharp analysis of Belgian politics and of the negative impact of the actions taken by the central banks during the credit crunch.
Clearly De Roeck is someone who will have interesting thoughts to share, and on the weblog In Flanders Fields (a central meeting blog for a lot of liberal visions) he gave his opinion on the subject of climate change. A subject on his website he calls a hoax:


Devaluatie van een Nobelprijs (Devaluation of a Noble Prize).
(As usual, my translations, J)

For a while already, climate has become an important issue in the media and thereby also in politics. With Al Gore winning the Noble Prize and an Oscar for his pseudo-scientific documentary 'An Inconvenient Truth' the eco-militants have won a battle. Suddenly, documentaries on the miserable life of the Indian children living on the streets are considered to be no more valuable than a computer simulation about the weather. Suddenly, the international achievements of world leaders like Mahatma Gandhi, Nelson Mandela & Kofi Annan are placed on the same level as the capers of a failed politician who's no more than a demagogue without scientific support.

Because of the orchestrated media-hype & mindless group-behavior of the doomsday-prophets in our media, nobody doubts the accuracy or correctness of "global warming". Nobody asks real questions any more. Some interesting op-ed's and critical thoughts on this climate-hype can be found here

[I’ve cut the other two links on his site because they are dead. Here is a starting point for more info on Lomborg]

I rarely write on the subject of climate change. Not because i wouldn' know anything about the subject; in contrast to most climate-prophets i actually took some biology classes; but simply because i don't care.
[According to his website, De Roeck is a master student in law. Seems he's refering to his biology class in high school ?
]

Frankly i don't care what happens to this planet. I'm terribly annoyed when seeing the behavior of scientists and politicians who crave for media attention. Nobody seems to care what the content of the message is as long as the message itself, no matter how wrong it is, is hailed with cheering and applause. It looks like an abundance of knowledge is not what scientists or politicians suffer from, but this fact doesn't bother opinion-makers at all.

Everybody talks about “global warming” while it is a scientific fact that Europe will suffer “global cooling” just because the first fundamental change in climate will be the halt of the North Atlantic Oscillation (NOA)
[actually, IPCC considers such a halt to be “very unlikely” and it's definetely not the first change that will happen] whereas this NAO is what keeps Europe’s temperatures high. New York is on the same latitude as Madrid but during winter it has plenty of snow and a harbor that freezes over.

Another piece of scientific nonsense is the human nature of climate change. Scientific research revealed man is responsible for no more than 5% of the emission of Greenhouse and other gasses that harm our environment. Those same scientists say 5% is a neglectable number.

[De Roeck misses the point the rise accumulates, p.ex for CO2 from 280 ppm to 390 nowasdays, much more than 5% that is.
]

The Brussels based Ludwig von Mises Institute Europe, in which I’ve been active for a while, follows the vision of the American Cato institute [a libertarian thinkthank, considered one of the better known
astroturf groups. Because of Cato's obvious far from centre position, De Roeck should be aware an exxon funded thinkthank maybe isn't the best possible source for gathering objective information J.]
, which is very critical towards the attempts of eco-fascists to use the media for spreading its lies towards to the general public in an attempt to force taking actions against the emission of GHG’s, even though there’s no scientific reason to do so. Annette Godart, president of LVMI-Europe, wrote an analyses entitled “Climate change: a hot item that requires cold" in which she writes :


Annette Godart Ludwig von Mises Institute global warming
Anette Godart
At the moment, climate change is one of the most discussed topics in the world. It seems, that even on Mars the Southern icecap is in danger and that Neptune appears to be warming too. [i've already adressed the 'argument' that other planets are warming too]

It is a very serious question, no doubt, and the safest way to discuss this, is to let it be examined by the capable scientists. But the problem is the fact, that a lot of emotions and opinions are blurring the outcome. It should not be the first occupation of politicians, but it is. I have only one question and I discovered, that people pay more and more attention to that fact.


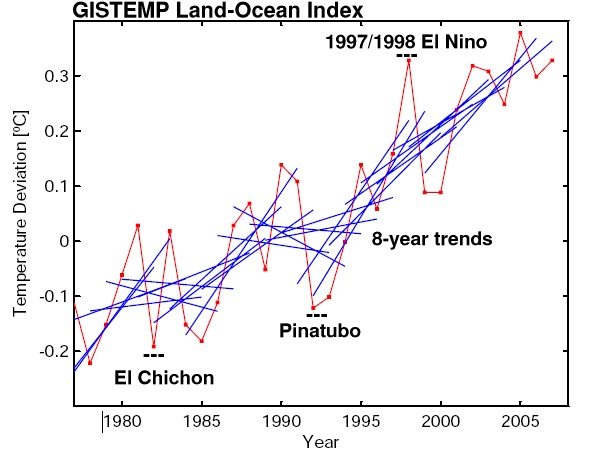
Between 1350 and 1700 there was a period, called “the Little Ice-Age”. That is a common fact. (Though in the 20th century there was a period of cooling too). Josef Reichholf, biologist and director of the zoological State collection has written an article about the topic. In the article “Wärme tut gut”
[translated : "heat does well" J.], he explains, that the climate change came quite suddenly, so suddenly, that the people were thinking of a punishment from God. The high tides were stronger in that period than those we ever knew in the 20th century. Storms were so strong, that they shaped the islands and Halligen between the Netherlands and Denmark. Temperatures could be measured at that period and dropped under minus 25 degree Celsius. People froze to death in their homes. Glaciers were growing longer, wolves came from the North etc.

In the Middle Ages on the contrary, the climate was so warm, that figs were growing in Cologne, Germany, and wine was produced in Bavaria, England, Belgium and the southern part of the Netherlands. Then, in 1700, that period of the “Little Ice-Age” stopped. The circumstances were not different from the period in 1350: no airplanes, no industry, no cars, no central heating and no pollution. There is research going on concerning this phenomenon. The Max Planck Institute of Darmstadt showed, that for example the sun was presently at an 8000 year solar max, which might explain the global warming.
[yes, the same old "it's the sun stupid !" meme]

By looking back in history, this piece of text shows us that causality between human factors and the environment are much less convincing than generally presumed in the media.

of course, this conclusion cannot be made from that piece of text. One needs to look at all factors influencing climate

From an Oscar-comittee I can understand it doesn’t pay too much attention to scientific truth because movies more often aren't depicting reality, but for a Noble Comittee there exist no excuses. A scientific institute that literally insults all previous nominees and mocks their achievements by giving Al Gore the Noble Prize, a cheating failure without any scientific grounds to stand on, and without any social surplus. This is a nice demonstration of the devaluation of the Noble Prize

I am a bit surprised by the high level of hybris in this post as De Roeck seems to very confident in calling a subject he doesn't know anything about 'unscientific'. Above that, De Roeck clearly fails to make distinction between Al Gore and climate science, even though those two clearly are separated subjects.

I hope Vincent De Roeck will make the effort to have a closer look at the scientific reality instead of copying faulty skeptical arguments the astroturf groups fabricate to misguide the public; and that he'll learn to be just as critical towards a source when the presented material says just what the personal bias wants to hear : rejecting science but using the thoughts of a polical thinkthanks instead, common Vincent, do you seriously wanna do that !? Reversed, it would mean basing your 'scientific' vision on reports produced by Greenpeace & Friends Of TheEarth kind of groups... The chance the info presented is going to be one-sided is high.

Yet as I know today Vincent is still a young puppy, i don't want to be too harsh : yes, young Vincent has a lot to learn on the use of sources, but i'm confident he will adopt this knowledge and in future will not just excel in biology, but will know his climate change just as well as he knows his goat.


Vincent De roeck know your goat Biology for beginners


Thursday 18 December 2008

Inhofe's 650 : what does it take to be called a scientist ?

The Inhofe 650-list is a clear case of the use of the authority-argument. The subtitle is :
More Than 650 International Scientists Dissent Over Man-Made Global Warming Claims
The list is an update of 2007 Inhofe 400-list, where the same idea was expressed as :
Over 400 Prominent Scientists Disputed Man-Made Global Warming Claims in 2007
If you do want to use such an authority-argument (imho never the best one anyway), then one would think it is necessary the people used do have some authority on the subject.

So it's a bit strange to see that there's a lot of economists on his list. Do they have any authority in the field of climate science ? What about a Philosopher ?

But even in the field of the people who one way or another can be linked to "exact" sciences, there's still room for questioning the authority of the scientists Morano mentions : how about someone who by no means can be considered an international scientist for nor does he have an academic diploma, nor did he ever work as a scientist. Someone like Ferdinand Engelbeen.

Engelbeen writes on his personal website :
After Technical Highschool, obtained a Bachelor Degree in Industrial Chemistry at the Institute of Technology in Antwerp in 1965.
In Belgium, people with this practically orientated degree are granted the title 'technical engineer' (ing), not to be confused with academic engineers (Ir.). It might be a bit confusing for foreigners, and Engelbeen does add to this confusing by often introducing himself as "a process engineer".

Yet, in my opinion it's Morano who is "using" Engelbeen for his own political agenda and Engelbeen himself isn't that much to blame for the confusion. After all, the latter always has been open about his background and doesn't pretend to be more than an amateur, p.ex. on this forum where he introduces himself in his first post with the words :
Ik ben geen wetenschapper in de strikte zin van het woord, maar redelijk wetenschappelijk aangelegd en volg het debat over het klimaat al ruim 30 jaar.
in English (my translation) :
I'm not a scientist in the strict sense of the word, but i have some talent for it and folow the climate-debate for 30 years
In Inhofe's report, Morano cites something Engelbeen wrote on his personal homepage. Which is the very same website Engelbeen gives a short biography of his life. Morano apparantly didn't do much effort profiling his "scientists" when compiling his list, for he easily could've known Engelbeen isn't a scientist, and certainly no scientist to be used as an authority.

Sunday 14 December 2008

Inhofe's 650 list misrepresents Belgian climatologist

Marc Morano in his '650 skeptics' list copies a misrepresentation, made last year, of the words of Luc Debontridder, scientist at The Belgian Royal Meteorological Institute.

Morano's report writes :
Climate scientist Luc Debontridder of the Belgium Weather Institute's Royal Meteorological Institute (RMI) co-authored a study in August 2007 which dismissed a decisive role of CO2 in global warming. The press release about the study read, "CO2 is not the big bogeyman of climate change and global warming.

This is the conclusion of a comprehensive scientific study done by the Royal Meteorological Institute, which will be published this summer.

The study does not state that CO2 plays no role in warming the earth." "But it can never play the decisive role that is currently attributed to it," Luc Debontridder said according to the August
2007 release.

"Not CO2, but
water vapor is the most important greenhouse gas. It is responsible for at least 75 % of the greenhouse effect. This is a simple scientific fact, but Al Gore's movie has hyped CO2 so much that nobody seems to take note of it," Debontridder explained. "Every change in weather conditions is blamed on CO2. But the warm winters of the last few years (in Belgium) are simply due to the 'North-Atlantic Oscillation'. And this has absolutely nothing to do with CO2," he added.
Source for Morano is a website of the New Zealand Climate Science Coalition, a well known group of skeptics who produce more noise than actual science.

Their website points to articles in two Belgian newspapers, one being on the website of "De Morgen" which is no longer online. The other article is on the (paid section) website of "De Standaard". I bought entrance to the article in which to my surprise Debontridder actually denies minimalising the role of CO2 (i'm not quoting the exact text, to not violate copyrights).

Moreover, Debontridder states in this article in De Standaard that what happened is that yet another Belgian Newspaper (Het Laatste Nieuws (HLN)) grossly misrepresented him and the RMI report.

The article of HLN also disappeared from the net, but the story was quickly picked up by well known Flemish climate skeptics, like the aforementioned Jos Verhulst and they copied the news in a forumpost on politics.be so we can still see what was written back then.

In HLN, Debontridder was quoted saying :

"... nu moeten we toch eens terug naar de échte realiteit. De hele reeks warme winters die we de laatste jaren hebben gehad, bijvoorbeeld, zijn simpelweg een gevolg van de Noord-Atlantische schommeling. Dat heeft nu echt eens niks met CO2 te maken".
Over de 'global warming-storm' ofte media hype zou hij hebben gezegd: "
Over enkele maanden hoor je er niks meer over. Precies doordat er zo overdreven op die CO2 werd gefocust, en alles op één hoop werd gegooid"
in English, my translation :

"... now we really need to enter reality again. the series of long winters we have known are simply a result of the NAO. It's totaly unrelated with CO2."
About the global warming hype he [Debontridder] said : "in a couple of months you won't hear about it any more. Just because everything was focussed on CO2."

People with a little bit of background on the subject will probably quickly understand by themselves how and where the confusion has risen. And how Debontridder could've gotten so misrepresented.

In an article (in Dutch) with Belgian magazine Knack, Debontridder leaves no doubt what his opinion on the subject is.

Some key passages (my translation) :
Luc Debontridder Inhofe 650 global warming misrepresentation
Luc Debontridder
"CO2 isn't the big cause of global warming" is what newspaper HLN concluded. "A complete misrepresentation", climatologist Luc Debontridder of the RMI says.

(...)

"as a scientist, i'd be absolutely crazy if i'd be saying CO2 isn't the main cause of global warming"

(...)

"RMI's new climate report has been wrongly interpret. Earth's warming of the past 20 years is caused mainly by CO2"
Later on, the Knack-article has a closer look where the confusion comes from and explains that without greenhouse gasses it would be minus 18 °C. Debontridder explains wator vapour is the most important GHG, but unlike what the NZ-coalition wants to insinuate, Debontridder is not minimalising the role of CO2 :
"The increased greenhouse effect is causing problems and of 60% of the effect comes from CO2"
Debontridder concludes :
"we cannot go on, following a busines as usual policy like this, but there's no need either to needlessly frighten the public. Bruges will not be on the coastline by 2050."
I think it is clear Morano's claim that Debontridder is a "climate-skeptic" is incorrect. Something Morano could've known without speaking Dutch, because the misrepresentation had already been mentioned on Michael Tobis' initforthegold blog
j'accuse.


UPDATE : do also read how this post lead to a quote-mined erratum in the Inhofe 700

Wednesday 12 November 2008

A layman’s guide on cherry-picking

Lately, a lot of attention has gone to the supposed fact that global warming stopped and that this proves IPCC’s projections to be wrong. To evaluate this claim, we need to split the presented subject into two separate questions :
  • did temperatures really stop rising ?
  • does the halt in warming (assuming there is one) disprove climate science ?
In this post i want to have a closer look at the first question : The claim AGW has stopped is one appearing in many slightly different ways. Looking at each of those individual claims would be rather time-consuming. Rather I seek to provide the reader some more background on climate science so he/she will be able to make valid judgments on such 'global warming is over' claims himself, or at least understand the more mathematical approaches on the web which are linked in the bottom.


Finding a decreasing temperature trend in data sets : easier than learning your ABC

I want to demonstrate in this post how easy it is, with a little bit of cherry-picking, to FABRICATE a trend line (we’ll presume all over this text it’s a linear trend) suited for making a exactly the claim you wanted to make before even looking at the data. Sure this claim will be very dubious, but 99% of your readers will not have the background to be able to detect the errors you deliberately inserted.

I want to look at the addressed issue from a certain viewpoint : Picture yourself to be a climate skeptic wanting to prove there’s no warming anymore. What would be the logical thing to do :

You’ll need to take the dataset showing earth’s surface temperatures and search if there’s a chance fabricating a negative trend line in it somewhere. In a set with so much noise and natural variability in it as the one of earth’s temperature, not surprisingly, choosing data suited for drawing the trend line you like best is fairly simple.

Simply draw a trend line between two carefully selected points on the graph so that you’ll have a downward trend. Whether this trend line actually is meaningful is another question which will be addressed later on. But first things first and let’s start by fabricating the trend line.


The art of shutting up on the things you don’t want the reader to know
It might sound a little silly, but when drawing a trend line, the important thing to remember is what the trend line you draw is all about. A trend line on temperature is a result of ALL processes that have an influence on earth’s temperature.

Climate shows a relatively big natural variability and when judging whether or not there’s an anthropogenic climate change, one will need to have a closer look at the importance of all those factors influencing climate.

There are several datasets that try to give an estimate for earth’s temperature. As you can see in the graph below, there are slight differences between the different sets, but those differences are quite small and averaged out of the years, and not relevant for the story to follow. (Actually, the data-sets all describe slightly different things, which explains)

When applying temperature trend lines on a graph like the one above, I suppose almost everybody will automatically agree you cannot simply compare two consecutive years and draw conclusions, because the differences between those two years will rather be the result of variability and noise than being indisputably part of a long-term climate trend.

Because two years clearly is a period way too short to compare, you’ll need to find a longer period to be able to draw meaningful conclusions : the image shown clearly shows there’s a lot of natural variability on the temperature signal, and as mentioned in my previous post, on top of that there’s a number of natural cycles also having an impact on the result. Using a reference period which is too short will result in comparing signal-noise instead of looking a real trend.

When reading articles on climate data, any reference period being remarkably short (like only a decade or so) should make you suspicious even though, when there’s simply lack of sufficient data, of course it is possible people are obliged to use shorter periods.

On a longer time scale, there are many cycles having an impact on earth’s temperature, the Milankovic cycles probably being the best known of them. Throughout history, temperature records clearly relate to those cycles. Yet, the importance of the Milankovic cycles on a scale of a century or so is rather ignorable because in such a short time span the changes or too small to be detected.

Yet besides the Milankovic-cycles, there’s of course other things having an impact an earth’s climate, like solar variability, aerosols, volcanism, etc… All these other factors and cycles do have a measurable effect on the data sets and therefore cannot simply be ignored as if they weren’t there.

It’s the sun stupid !

One of the factors having an impact on our climate is variability in solar radiation.

Actually, a claim frequently made by skeptics is that present day changes in surface temperatures are not a result of man-made GHG’s, but changes in temperature are simply following changes in solar radiation. Science disagrees on this claim because those changes simply are too small to (fully) explain present day warming, yet changes in solar radiation DO have a (minor) impact on earth’s temperature. So this factor cannot explain why earth’s temperatures have been rising lately and the skeptics claim is disproven. Above that, the last couple of years have seen a decrease in solar activity while temperatures were soaring

But back to the trend line we wanted to draw :

When we put a decreasing trend like the one from solar radiation into a graph we’ll get an negative trend line like the blue line in the image below.

Clearly, as said the trend to be expected from the change in solar variability (blue line) is negative for the period shown in the graphic from point A to B.

Suppose the temperature data as they were recorded (the red arrow) does follow that negative trend, but not as much as expected. Then this implies there must be second factor having an influence on the temperature (p.ex. AGW), yet not enough to compensate the negative trend set by the change is solar variability. If the second factor would've been bigger, the actual trendline even could've become positive, totally hiding the cooling trend from the sun...

The thing to remember is : Even though in the selected period the temperature-trend is negative, what it really shows is that besides the negative solar-effect there actually IS (the green area) a second factor with a positive temperature effect ! You can't present your result without mentioning this.

Of course if you do shut your mouth about all the underlying science and simply present the image above, but with nothing on it but the red trend line, you can happily present your conclusion like p.ex. global warming stopped (silently suggesting man has no effect on earth’s climate).

Sure, the facts you presented are incomplete, but very useful anyway in non-scientific environments. The power of knowing what to not say can never be underestimated !

Unfortunately, the method presented to fabricate a decreasing trend as described here isn’t sufficient because solar variance is too small. We’ll need to look a bit further. All we need to find is something with an effect that’s big enough to help us to reach our goal.


Oscillations Schmoscillations

In my previous post, I mentioned there’s a natural cycle called the El Nino Southern Oscillation (ENSO) which does have an measurable impact (and a rather big one) on earth’s surface temperature.

Typically, an oscillation looks like shown in the image below. Clearly, the ENSO-oscillation will not be as perfect as the one presented here, but the image is suited for continuing our search towards a negative temperature trend.

When looking at the image, what’s the long term trend on the oscillation do you think ?

If your answer is : it’s a status quo (the green line), this simply means you are an alarmist who isn’t able to understand real science.

The correct answer of course is the image shows a downward trend. And I’ll prove it !

Not by altering data or making errors in calculations or anything. I’ll use exactly the same data set as the picture above. Yet, what I want to do is to cleverly pick the right spots to support my claim.

Remember, we want to prove there’s a decreasing trend in temperature, so the best thing to possibly do is start your trend line on the highest possible point in the graph below (like, p.ex. point A)

The point where your trend line stops has to be as low as possible. I’ve chosen three similar points on the bottom of the graph (B, C, D) and drawn the trend lines. Later on we’ll decide which one suits us best.

Notice there’s something very awkward with those trend lines : even though they all three connect points on the same level, the slope of the trend line differs. I’ve isolated the trend lines so it’ll be easier to see :

The longer the time period between the points that have to be connected, the more horizontal it becomes. Or in other words : the more it will approach the real trend (green line) until at some point it will become indistinguishable from the real trend. (Science actually has a couple of methods to transform the data and make it easier to distinguish trends and noise)

This difference in slope of the trend lines of course is the reason in climate science you need to take periods that are long enough (an absolute necessity is to overcome the ENSO oscillation) otherwise you’ll only be comparing noise instead of the real long-term trend.

Because in this post the aim was to draw a trend line that decreases as much as possible, what we need to do is ignore the paragraph above and take the trend line which suits us best. So we’ll go for the trend line on a very short time span : trend line n° 1 is the one we want to use !


Now, with all the things we've learned, we are almost ready to take the real data of surface temperatures and find the points we want to connect to get our desired trend.

A last thing we need to do is to select the years we want to connect : preferably starting from a year with a temperature above average (an El Nino year would be perfect for this) and a colder year (like a La Nina year).

Luckily, 2007 & 2008 both have been partially La Nina years and therefore are very useful to be used as an end point in our trend line. Just our luck ! The last thing is to find a year warm enough to make sure our trend goes down. Like an El Nino year. And this, as we've learned, in a time span that is as short as possible without becoming so short even laymen will ask questions about the reliability of the trend you're presenting. Whereas one year might be a bit exaggerated; surely something in between 5 a 10 years is more than long enough !

Now it's time to look at the actual data : immediately we see the strong El Nino effect in 1988, which is exactly ten years ago. It's a bit an outlier in the data sets. (see image 1), but we’ll use it anyway because it will give us the trend we wanted in the first place ...


There’s one more thing left to do : look at the actual data and see if your carefully picked data really have a downward trend. You still need to verify this because of what i explained under the solar variance paragraph : it's still possible there's a factor causing an upward trend which overrules the trend you've picked.

There are several data sets : if one doesn't show the desired result, try your luck by picking another one (p.ex. HadCRU instead of GISS). No layman will ever find out about the existance of the other sets contradicting your conclusion, so it's absolutaly safe to ignore them.

If the trend line, despite your carefully selected data still isn’t going downward, look for another starting point. If necessary, shorten your time span from 10 years to 9 years. Or even less. Don't be shy.


What happens if you make the time span of your trend line too short is clearly shown on this graphic :

This aren’t meaningful trend lines any more but Mikado. Shortening the time period to seven years naturally makes it even worse :

(El Chicon & Pinatubo are volcanoes which in the given years had major eruptions, causing a temporary global cooling effect which could be detected in the data set)

The last two images are taken from this article from the excellent website RealClimate and is well worth reading. With the explanation above, I hope even people with no scientific training are able to understand what’s written in the RC article.


If you want to read even more, I recommended these links :

Robert Grumbine on cherry picking

Maybe a bit more difficult, but still worth reading : statistician Tamino on ‘global warming stopped in 1988’ and the use of short term trends in this three posts :

Garbage is forever

Wiggles

Global Temperature from GISS, NCDC, HadCRU

Saturday 8 November 2008

Jos Verhulst on Hurricanes and Climate Change

In this post (in Dutch) on Belgium's biggest forum about politics Jos Verhulst, who is co-author on the conservative blog The brussels journal mentions that the the past two years have been below average on hurricane-activity.Jos Verhulst klimaatverandering

Verhulst writes :
Het voorbije jaar 2007 was, in schril contrast met allerlei deskundige voorspellingen, behoorlijk slap op orkaangebied. Het ACE-totaal kwam voor het noordelijk halfrond uit op 73% van het gemiddelde voor de laatste 26 jaar. En 2008 is tot op heden evenzeer in mineur verlopen.

in English, his word would mean something like (my translation) :
In sharp contrast with what experts predict, the last two years have been minor ones on the field of hurricanes. The ACE-total for the Northern Hemisphere ended on 73% of the average level of hurricane activity of the past 26 years. Above, 2008 also has shown a small hurricane-activity.

In science, hurricane activity in isn't measured by simply adding the number of hurricanes because that number doesn't say anything about the strenght of the hurricanes. Instead, scientists use an index developed by the American National Oceanic & Atmospheric Association (NOAA) which is called the ACE-index (Accumulated Cyclone Energy). This index takes into account the number, strength and duration of all tropical storms in the season.

Verhulst shows a graphic from Florida State University to support his findings :

Is Verhulst's claim correct that climate science's predicted increased hurricane activity is falsified by this graphic which shows the last two years have shown lower activity?

Well, err, no of course not !


Hurricane activity is closely related to the sea-surface temperature (SST), and this SST is something that shows huge interannual variability, most notably because of the El Nino and La Nina events, or as scientists call it : The Southern Oscillation (often referred to as the El Nino Southern Oscillation ENSO)

The KMMI (Royal Dutch Meteorological Institute) gives a nice explanation in Dutch : click

The reason the Nino/Nina events are important enough to be taken into account is the fact they alter the SST in the areas where hurricanes are formed. And the change is this big, that it clearly has an impact on hurricane activity : when you look at the years there were Nino/Nina years, and compare this to the image below, there's no doubt at all : these events have a dramatic impact on SST temperatures in areas where Hurricanes are formed.


If you look at the graphic presented by Jos Verhulst there's a very straight correlation with the Southern Oscillation :

  • The low parts of the graphic are the years there's a La Nina
  • The top parts are the years there's a El Nino event.
This means there's a very close relation between SST and hurricane activity !


This implies:
  1. science's claim that increasing temperatures could result in a higher ACE-index isn't all that weird
  2. Verhulst's claim on the ACE-index of 2007/2008 is incomplete : he forgets to take into account in which phase ENSO is at the moment, for this matters.
2007 & 2008 were years there's a ... La Nina.

Or in other words: those two years have had lower SST's because of the ENSO, and therefore showed lower hurricane activity.

Therefore, Verhulst's claim that the last two years have known hurricane below the average off the last 26 years is ... exactly what one would expect.

One again, we can see that in climate science, you cannot draw conclusions out of very short time periods. Verhulst's base period simply is way too small to conclude anything.

Shamefully, Verhulst made this post exactly one day after i explained to him his baseperiod on another topic (sea level rise) was ... too short. And this by far hasn't been the only error Verhulst has made on politics.be on the field of climate change.

My conclusion is very clear :
Despites his high level of arrogance towards the scientific community, Jos Verhulst demonstrates time after time after time he fails to understand climate science. Verhulst instead is just another libertarian who gets blinded by his bias. Hereby helped by the known inreliable websites he frequently cites like e.g. co2-science

Verhulst concludes his post with :
Men kan nu een eenvoudige geestelijke oefening uitvoeren. Beeld u in, dat tijdens de laatste twee jaren de orkaanactiviteit sterk bovengemiddeld ware geweest. Denkt u, dat de media over deze bovengemiddelde activiteit dan dezelfde radiostilte in acht zouden nemen, die we nu vaststellen in verband met de sterk verlaagde activiteit? Denkt u, dat men dan zou zeggen dat twee jaar een te korte periode is om conclusies te trekken?

De vraag stellen is ze beantwoorden. Let maar op het propagandistisch wolvengehuil dat zal opstijgen, zodra er weer een jaar komt met meer orkanen dan gemiddeld.

or, in English (once again, my translation) :
Time to make a little mental exercise : picture that the last two years, hurricane activity would have been above average : do u think the media would have been as silent about the topic as they are now activity is below average ?
Asking the question means you have to answer it : be sure that the wolves' cries of propaganda will rise again as soon as there'll be a year activity is above average.


As Sarah Palin would say : it's all about the liberal media elite.

Thursday 30 October 2008

They predicted a cooling in the 70ies

As you've all noticed i haven't had much time lately to blog because of work-related reasons. And also because, even though this blog just started, it already did generate a lot of private mailing of people commenting on the things i write. Which pleases me because it seems this blog, as was the aim when starting it, is filling the hole there still was in the Dutch speaking part of the world.

One of the claims people sceptical towards climate science often repeat is the one that 'back in the 70ies they predicted a cooling' where the argument should suggest 'them' predict no matter what, as long as 'them' can claim the end of the world is near.

Besides the logical problems with the argument itself (scientifical knowledge accumulates, which can result in a paradigm shift) there's something even more problematic with the argument : it seems it simply isn't correct.


Peterson, Connolly & Fleck had a closer look at the publications made in the 70ies and presented the result of their investigation in the Bulletin of the American Meteorological Society Their conclusion leaves no doubt :
There was no scientific consensus in the 1970s that the Earth was headed into an imminent ice age. Indeed, the possibility of anthropogenic warming dominated the peer-reviewed literature even then.
Co-auther William Connolly runs an (excellent) blog called Stoat where the entire paper can be found (pdf). Simply a must read !